The modern world runs on data. Let's run your world!
I will create a professional and interactive report/dashboard specifically tailored to your business needs.
This type of work is project-specific and so pricing is flexible.
Please connect with me to receive an estimate for your project.
To begin, I'll need to see your data and your requirements about visuals/reports/dashboards.
The project will include:
- Data Source Connectivity (Excel, SQL Server, Azure DB, SharePoint, etc).
- Data Manipulation and Transformation.
- Data Visualization using the most appropriate visuals.
- Data Modelling and Relationships
- Data Filtering using slicers and/or user-defined parameters.
- Publishing the Reports to Server provided by you (Alternatively, will send a .pbix file)
- Perform advanced Calculations using the DAX language
- Fully Interactive Live Dashboards
I will provide detailed Report Documentation explaining the metrics used in the report. Interpretation of visuals and tips on navigating in Power BI will also be delivered.
Additionally, I'll provide Consultations on Power BI and its usability.
Will advise you on building a data pipeline that can meet your Business Requirements.
Examples:
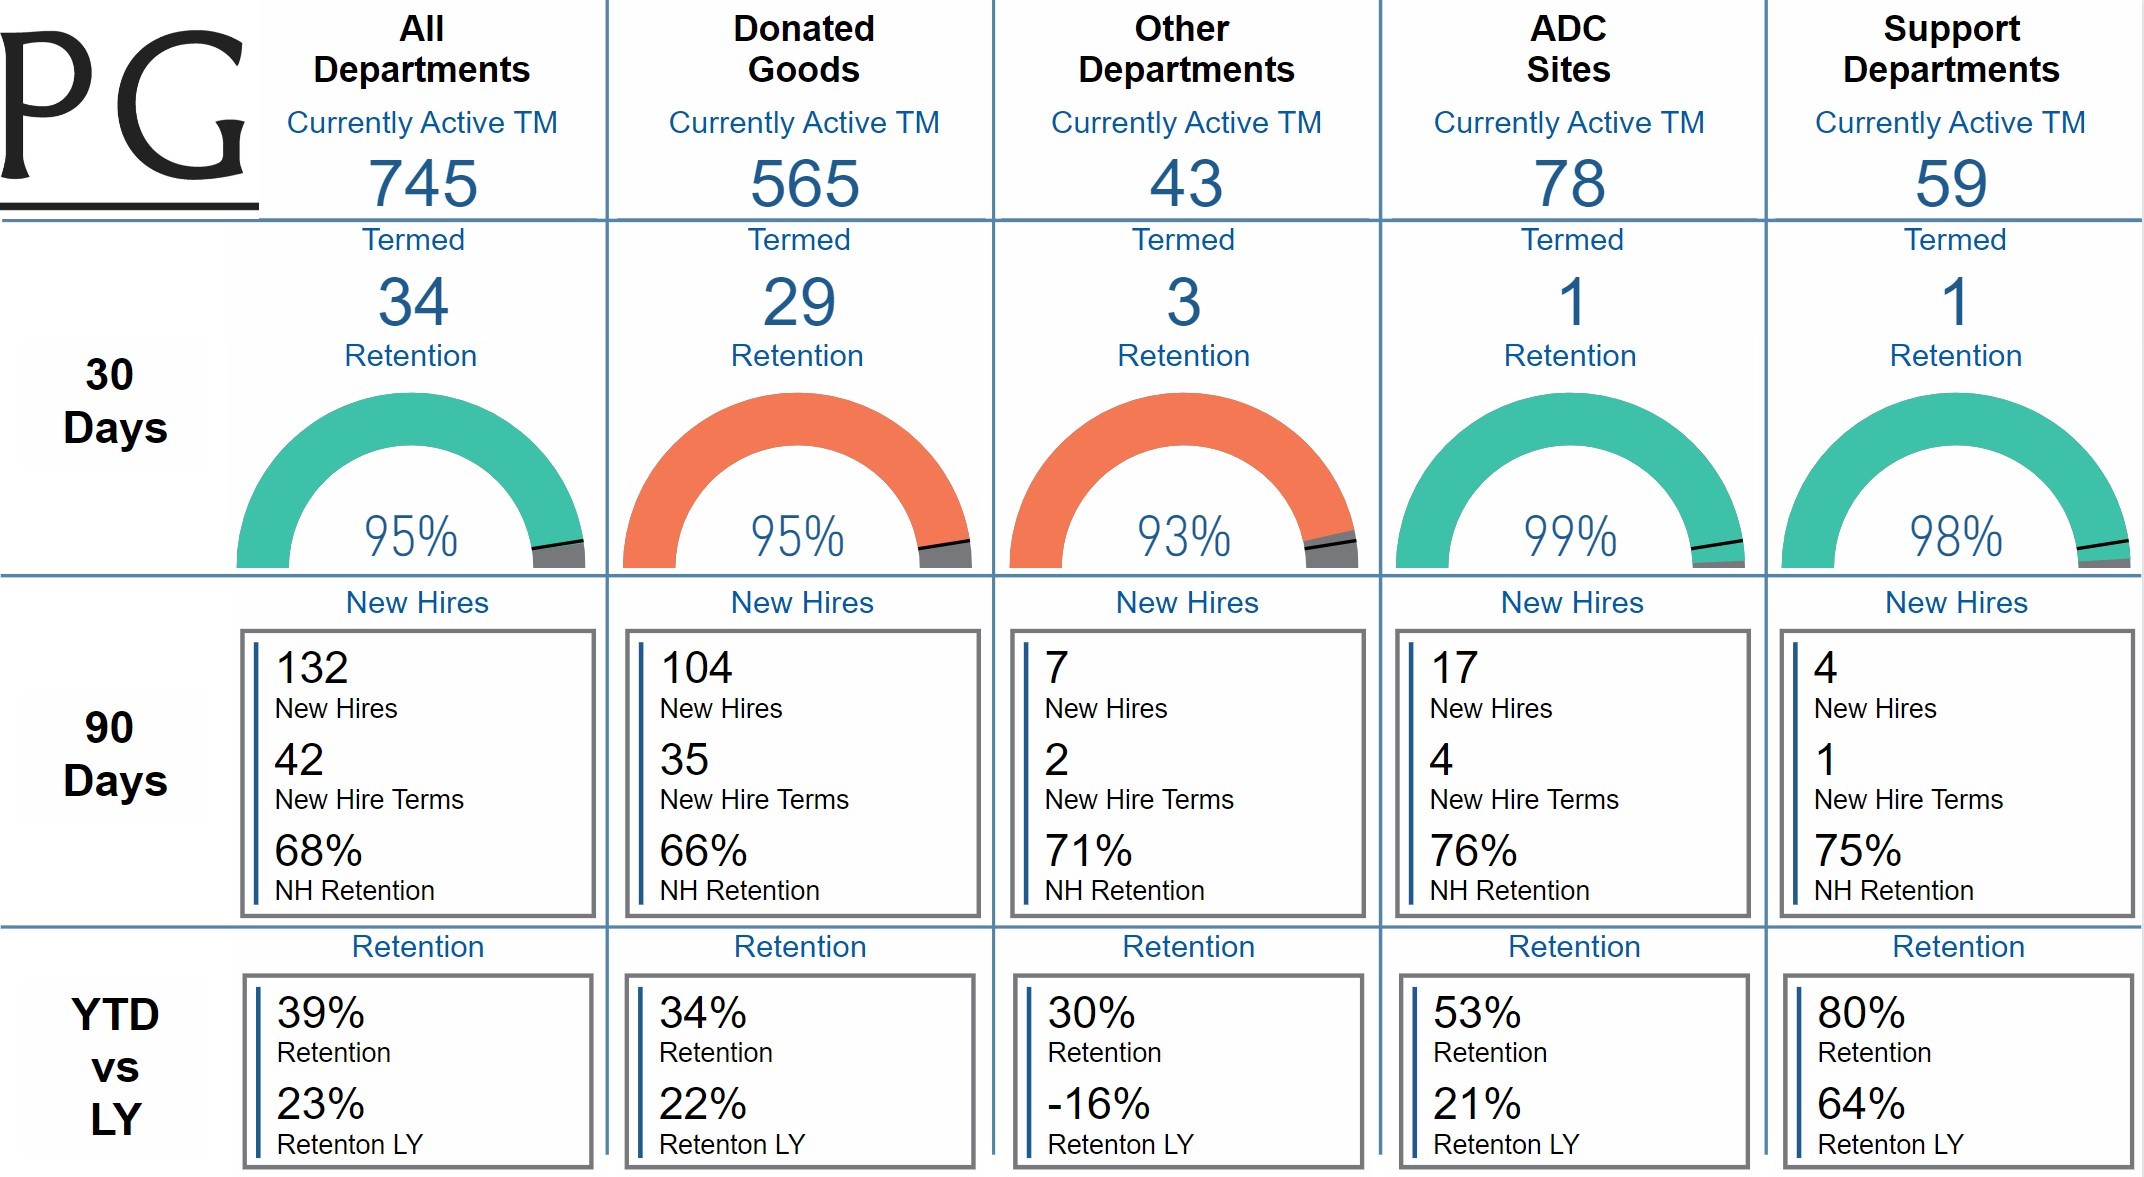
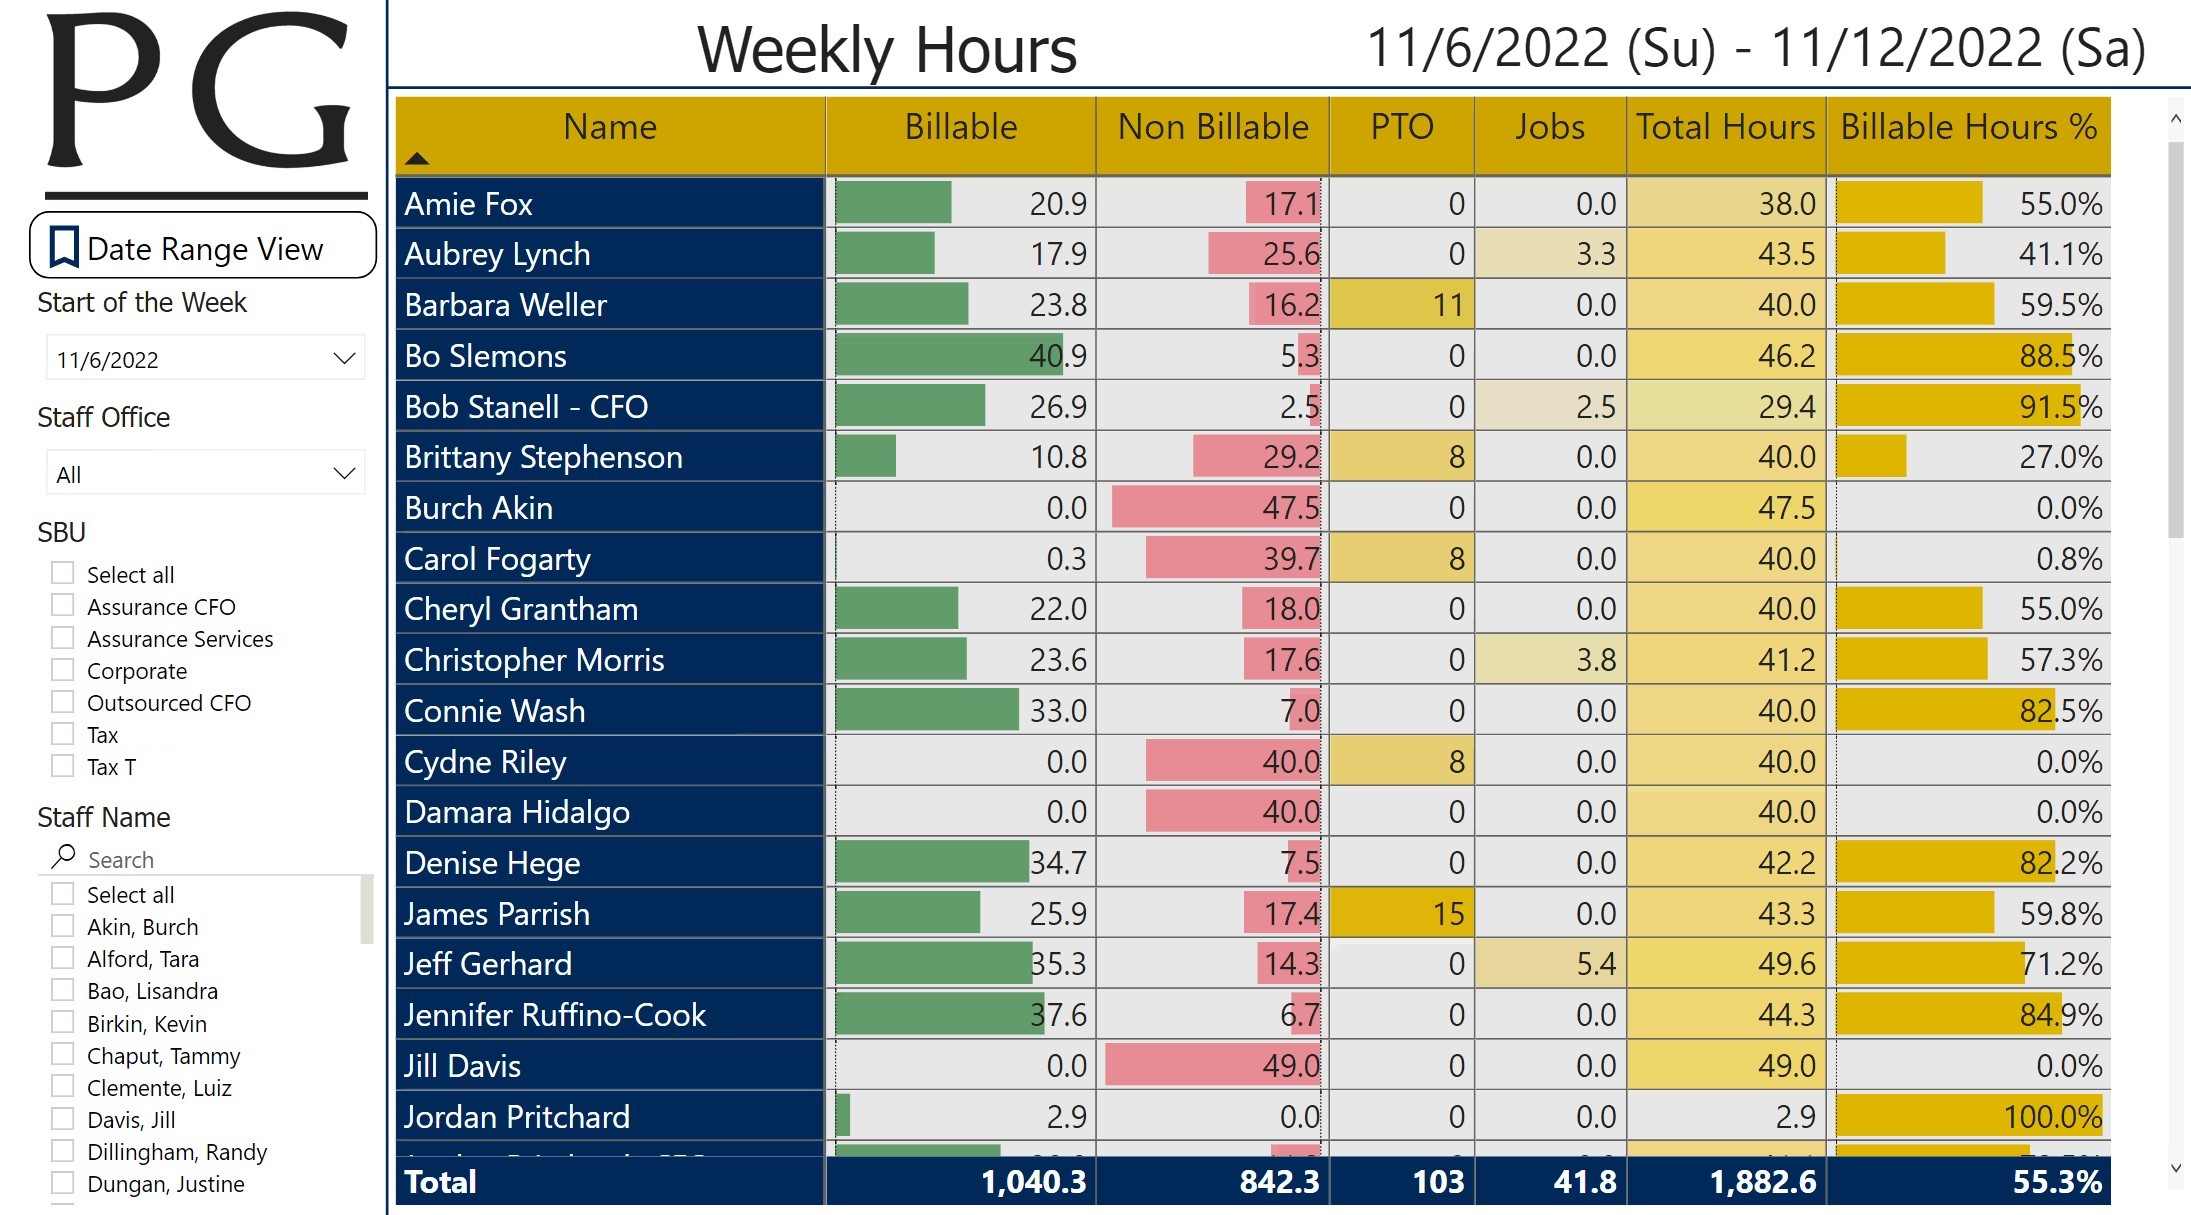
I've covered the logo as well as some other information on these reports for Client confidentiality purposes*